Business Model Canvas: From Template to Working Model with Real Numbers
I've seen hundreds of Business Model Canvases. On conference room walls, in Miro boards, in pitch decks. And here's what 90% of them have in common: beautiful sticky notes, the right words, and a complete absence of numbers. Teams fill out the canvas at a strategy workshop, take a photo, share it in Slack, and forget about it. Six months later, they pull it out for the next pitch and start over.
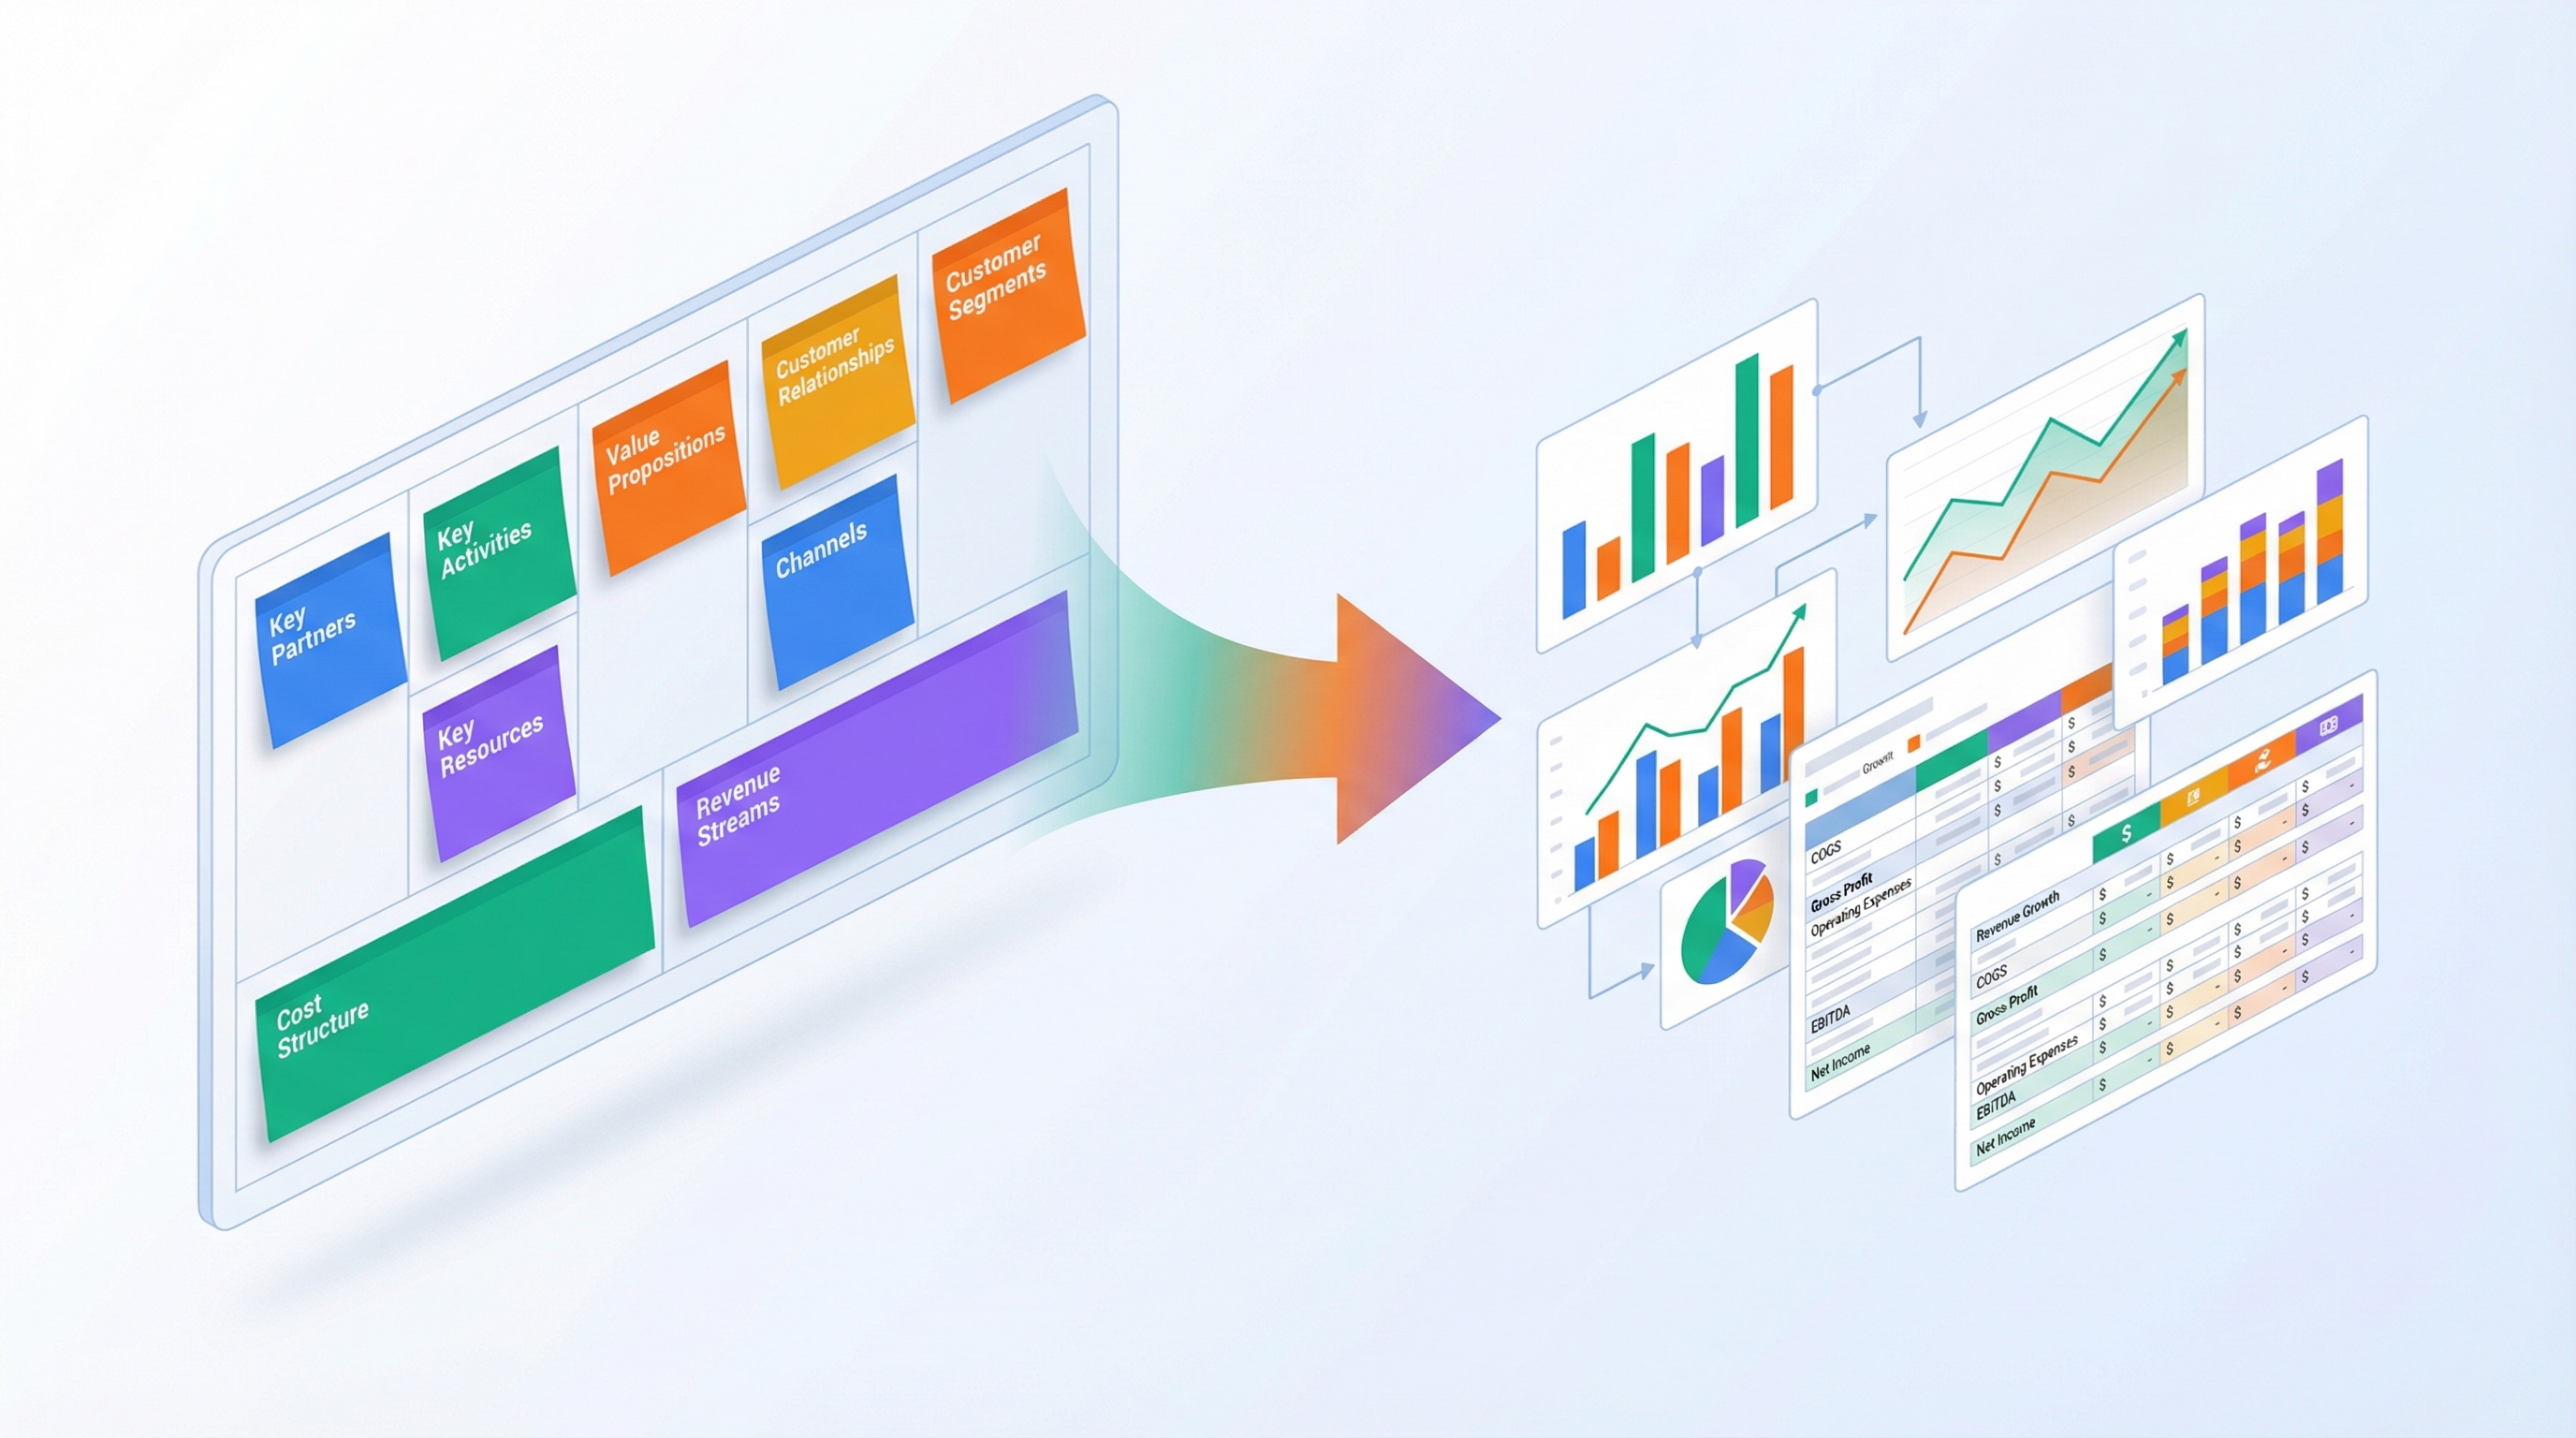
The problem isn't the tool. The problem is that BMC gets used as an exercise, not as the foundation of a financial model. In this article, I'll show how each of Osterwalder's 9 blocks translates into a concrete P&L line item — with formulas, numbers, and a worked example.
BMC: Why 90% of Canvases Stay on the Wall
Business Model Canvas is Alexander Osterwalder's framework from "Business Model Generation" (2010). Nine blocks on one page: from value proposition to cost structure. The idea is brilliant in its simplicity — your entire business on a single sheet.
But simplicity is also a trap.
A typical BMC looks like this:
- Value Proposition: "Convenient tool for data analytics"
- Customer Segments: "Small and medium businesses"
- Revenue Streams: "Subscription"
- Channels: "Digital marketing"
Every point is true. And every point is useless. Because "subscription" without pricing, tiers, and conversion projections is a hypothesis, not a business model. "Digital marketing" without a budget, funnel, and CAC is a wish, not a plan.
Canvas without numbers = a set of hypotheses. Canvas with numbers = a financial model foundation.
The connection is direct: each BMC block maps to a specific P&L element. Value Proposition determines pricing. Channels determine CAC. Customer Relationships determine churn. Revenue Streams are the income side. Cost Structure is the expense side. All that remains is turning words into numbers.
9 BMC Blocks: Filling Them with Financial Modeling in Mind
Customer Segments: Target Cohorts for Unit Economics
Standard entry: "SMB, 50-500 employees, B2B." Useful for marketing, useless for modeling.
Financial-grade filling requires segmentation by willingness to pay:
| Segment | Team Size | Willingness to Pay | Share of Revenue | Churn |
|---|---|---|---|---|
| Startups (seed) | 3-10 | $29-49/mo | 40% | 8% |
| Growing SMB | 10-50 | $99-199/mo | 35% | 4% |
| Mid-market | 50-200 | $499+/mo | 25% | 2% |
Why this matters: different segments have different ARPU, different churn, and different acquisition costs. If you calculate unit economics as a blended average, you miss that startups leave after 4 months while mid-market stays for 3 years. Without segmentation, LTV is fiction.
For startups: 487. For mid-market: 24,950. A 50x difference. This changes everything — from channel selection to product team priorities.
Value Propositions: Value = Willingness to Pay = Pricing
"We save time on analytics" — a typical sticky note. But value in a financial model is a specific dollar amount that customers will pay to solve their problem.
The rule: value proposition should be expressed in the customer's money.
| Value (sticky note) | Value (in customer's money) | Your Price |
|---|---|---|
| Save 10 hours of analyst time per month | 50/hr rate) | $99/mo |
| Reduce reporting errors by 40% | $2,000/mo (cost of errors) | $199/mo |
| Replace 3 tools with one | $150/mo (sum of subscriptions) | $49/mo |
Pricing flows from value. The standard benchmark: product price = 10-20% of value to customer. If your product saves 99 is 20% — a workable level. If you charge 500 in savings, conversions will suffer.
Channels: Acquisition Channels with CAC
In classic BMC, channels are "how we deliver value." In a financial model, they're a funnel with concrete parameters at every stage.
Each channel is a formula:
Example:
| Channel | Budget/mo | Reach | CTR | Conv. | Customers/mo | CAC |
|---|---|---|---|---|---|---|
| Google Ads | $8,000 | 80,000 | 3% | 2.5% | 60 | $133 |
| Content SEO | $3,000 | 25,000 | 5% | 3% | 38 | $79 |
| Partnerships | $2,000 | — | — | 15% | 12 | $167 |
| Referral | $1,000 | — | — | 25% | 20 | $50 |
Channels are not abstractions. They're expense lines in P&L and revenue-side drivers. For more on evaluating channel ROI with lifecycle considerations, see the article on marketing channel ROI.
Customer Relationships: The Retention Model
BMC sticky note: "Personal support, email campaigns, onboarding." Financial model: churn rate and retention curve.
The type of customer relationship directly determines the retention curve:
| Relationship Type | Monthly Churn | 12-mo Retention | LTV Multiplier |
|---|---|---|---|
| Self-service (no support) | 8-12% | 25-35% | Low |
| Automated + onboarding | 5-7% | 40-55% | Medium |
| Personal CSM | 2-4% | 60-80% | High |
| Contract + integration | 1-2% | 80-95% | Maximum |
At 5% monthly churn, after 12 months you retain of a cohort. At 2% — . These aren't just numbers — they're the difference between a business that grows and one that treads water. For a deep dive into cohort analysis and retention modeling, see the dedicated article.
Revenue Streams: P&L Revenue Structure
"Subscription" in the BMC is just the beginning. A financial model requires decomposition:
| Revenue Source | Type | Formula | Example |
|---|---|---|---|
| Pro Subscription | per_active_unit | Active\_Users_{Pro} \times \49$ | 9,800 |
| Enterprise Sub | per_active_unit | Active\_Users_{Ent} \times \199$ | 9,950 |
| Setup fee | per_new_unit | New\_Ent \times \500$ | 2,500 |
| API overage | percentage_of_base | API\_calls \times \0.001$ | 500 |
It's important to separate streams by type: recurring (subscriptions), transactional (one-time payments), usage-based (consumption). Each type has its own predictability: recurring is forecast via retention curves, transactional via new customer flow, usage via average consumption per user. The full revenue structure breakdown is covered in the P&L modeling guide.
Key Resources: Team and Payroll
BMC: "Development team, server infrastructure, data." P&L: the largest expense category.
Key Resources in a financial model means a hiring plan tied to a timeline:
| Resource | Cost/mo | Starting Month | Annual Cost |
|---|---|---|---|
| CTO | $6,500 | 0 | $78,000 |
| 2x Senior Dev | $10,000 | 0 | $120,000 |
| Junior Dev | $3,200 | 4 | $28,800 |
| Designer (50%) | $2,000 | 0 | $24,000 |
| Product Manager | $5,000 | 6 | $35,000 |
| AWS/GCP | 0.5/user | 0 | $12,000+ |
Don't forget taxes: depending on jurisdiction, that's 15-35% on top of gross salary. For a 7-person team with 4,500-10,500.
Key Activities: Operational Expenses
BMC: "Development, marketing, support." P&L: periodic expenses not directly tied to customer count.
| Activity | Expense Line | Type | Amount/mo |
|---|---|---|---|
| Development | SaaS tools (GitHub, Figma, Slack) | Fixed | $600 |
| Marketing | Ad budget | Variable | $14,000 |
| Support | Helpdesk + docs | Mixed | 1/user |
| Analytics | BI tools, tracking | Fixed | $300 |
| Compliance | Legal, audit | Periodic | $1,000 |
The key distinction: fixed vs. variable expenses. Fixed costs exist from month zero regardless of growth. Variable costs scale with the user base. This matters for calculating contribution margin and the break-even point.
Key Partnerships: Commissions and Revenue Share
BMC: "Integration partners, resellers." P&L: acquisition cost or shared revenue.
Partnership models in financial terms:
| Partnership Type | Model | Formula | Example |
|---|---|---|---|
| Reseller | Revenue share | 2,000/mo | |
| Affiliate | Bounty per unit | New\_Users_{aff} \times \50$ | 15 x 750/mo |
| Integration | Fixed fee | $500/mo | |
| White-label | License + % | 5,000 = $6,000/mo |
Partnership costs often sit between CAC and COGS. Bounty is essentially CAC for the partner channel. Revenue share reduces either revenue or is COGS. In the model, you need to decide where it belongs — this affects Gross Margin.
Cost Structure: The Expense Side of P&L
The final BMC block — also the summary expense section of the model. Everything comes together here:
| Category | BMC Source | Share of Expenses | Type |
|---|---|---|---|
| Team (Payroll) | Key Resources | 55-70% | Fixed |
| Marketing | Channels | 15-25% | Variable |
| Infrastructure | Key Resources | 5-10% | Mixed |
| Partners | Key Partnerships | 3-8% | Variable |
| Operations | Key Activities | 5-10% | Fixed |
There's the full picture: 9 BMC blocks assemble into two sides of a P&L — revenue and expenses. The canvas stops being a diagram on the wall and becomes a working financial model.
Example: Filling BMC for a SaaS Analytics Platform
Let's work through a concrete product: a SaaS business analytics platform for e-commerce. Monthly subscription, three tiers, B2B.
BMC with Numbers
Customer Segments
- Online stores with $50K-500K/mo revenue (primary segment, 60%)
- Marketplace sellers with 10+ SKUs (secondary, 30%)
- D2C brands (niche, 10%)
Value Propositions
- Automated reports instead of manual exports (saves 15 hours/mo = 50/hr)
- Predictive demand analytics (reduces lost sales by 12%)
- Single dashboard replacing 4 tools (saves $200/mo in subscriptions)
Channels
| Channel | Budget | Reach | Funnel | Customers/mo | CAC |
|---|---|---|---|---|---|
| Google Ads | $6,000 | 60,000 | 3% -> 10% -> 8% | 14 | $429 |
| Content/SEO | $2,500 | 20,000 | 4% -> 12% -> 6% | 6 | $417 |
| Partners (integrations) | $1,500 | — | — -> — -> 15% | 8 | $188 |
| Referral | $500 | — | — | 5 | $100 |
| Total | $10,500 | 33 | $318 |
Customer Relationships
- Automated onboarding (14-day trial -> 25% conversion)
- Email nurturing (5 touchpoints during trial)
- Personal CSM for Enterprise ($199+)
- Monthly churn: Starter 7%, Pro 4%, Enterprise 2%
Revenue Streams
| Tier | Price | Share of New | ARPU |
|---|---|---|---|
| Starter | $29/mo | 45% | $29 |
| Pro | $79/mo | 40% | $79 |
| Enterprise | $199/mo | 15% | $199 |
Blended ARPU: 79 x 0.40 + 13.05 + 29.85 = $74.50
Key Resources
- Team: CTO (8K), designer 50% (3.5K), CSM (22,000/mo + 21.5% taxes = $26,730/mo
- Infrastructure: AWS 0.3/user
Key Activities
- Feature development (2-week sprints)
- Content marketing (4 articles/mo, 2 webinars/quarter)
- Platform integrations (Shopify, WooCommerce, BigCommerce)
Key Partnerships
- Shopify App Store (20% revenue share)
- Partner integrations (bounty $100 per user)
- Content partnerships (barter)
Cost Structure
- Team: $26,730/mo (70%)
- Marketing: $10,500/mo (27%)
- Infrastructure: $1,200 + variable (3%)
- Total fixed: $38,430/mo
How BMC Becomes P&L
Now let's build the P&L at month 12 (base scenario: 33 new customers/mo, blended churn 4.7%):
| P&L Line | BMC Source | Month 1 | Month 6 | Month 12 |
|---|---|---|---|---|
| Revenue | Revenue Streams | $2,459 | $12,780 | $22,872 |
| Subscriptions | Tiers x Active Users | $2,459 | $12,780 | $22,872 |
| COGS | Key Partnerships | -$492 | -$2,556 | -$4,574 |
| Shopify rev share (10%) | Partners | -$246 | -$1,278 | -$2,287 |
| Infrastructure | Key Resources | -$246 | -$1,278 | -$2,287 |
| Gross Profit | $1,967 | $10,224 | $18,298 | |
| OpEx | -$37,230 | -$37,230 | -$38,930 | |
| Team (Payroll) | Key Resources | -$26,730 | -$26,730 | -$26,730 |
| Marketing | Channels | -$10,500 | -$10,500 | -$10,500 |
| Operations | Key Activities | — | — | -$1,700 |
| Net Income | Cost Structure | -$35,263 | -$27,006 | -$20,632 |
Gross Margin: 80% (healthy for SaaS). But net income is still negative at month 12 — more customers or higher ARPU needed to break even. At current parameters, break-even lands at months 22-24.
From Canvas to P&L: Bridging Strategy and Finance
Revenue Streams -> Income Model
Each BMC revenue source becomes a line in the income model with a specific accrual type.
| BMC Revenue Stream | P&L Type | Driver |
|---|---|---|
| Subscription | per_active_unit | Active Users x Price |
| One-time setup | per_new_unit | New Users x Setup Fee |
| Transaction commission | percentage_of_base | GMV x Commission% |
| Freemium -> Premium | per_active_unit | Active Free x Conversion% x Price |
The key: accrual type determines how revenue scales. Per_active_unit grows with retention. Per_new_unit depends only on inflow. Percentage_of_base is tied to someone else's volume. This fundamentally changes the shape of the revenue curve.
Channels + CAC -> Channel ROI
Each channel from BMC is an investment with a return. Channel ROI is calculated by comparing the LTV of acquired customers to acquisition costs:
For our example (LTV at blended churn 4.7% and ARPU $74.50):
| Channel | CAC | LTV/CAC | ROI |
|---|---|---|---|
| Google Ads | $429 | 3.7x | 270% |
| Content/SEO | $417 | 3.8x | 280% |
| Partners | $188 | 8.4x | 743% |
| Referral | $100 | 15.9x | 1,485% |
The conclusion is obvious: partner and referral channels are 3-4x more efficient than paid advertising. But they have limited capacity. The model must account for each channel's ceiling.
Cost Structure -> Expenses
BMC Cost Structure unfolds into a monthly budget with fixed vs. variable breakdown.
Fixed costs set the break-even "threshold." Variable costs determine the marginal profitability of each additional customer. Contribution Margin — what remains after deducting variable costs — must be positive, otherwise growth is unprofitable.
For our SaaS: 0.30 infra + 74.50 - 72.04. Contribution Margin of 97% — excellent.
Customer Relationships -> Retention -> LTV
The relationship type from BMC determines the retention model, which in turn drives LTV:
where is the monthly discount rate. At a 15% annual rate: .
If BMC says "automated onboarding + email," that's 5-7% churn. If "personal CSM + integration" — 1-3% churn. The LTV difference: 3,725. A 2,661 more in LTV.
Lean Canvas vs Business Model Canvas: When to Use Which
Ash Maurya's Lean Canvas is a BMC modification for startups. Substitutions: Key Partners -> Problem, Key Activities -> Solution, Key Resources -> Key Metrics, Customer Relationships -> Unfair Advantage.
| Criteria | Business Model Canvas | Lean Canvas |
|---|---|---|
| Focus | Entire business model | Product-market fit |
| Best for | Company with clear market | Startup in search mode |
| Key Partners | Yes | No |
| Key Metrics | No (add manually) | Yes (built-in block) |
| Problem/Solution | No | Yes |
| P&L Connection | Direct (all 9 blocks) | Partial (no team, partners) |
| When to fill | When building a financial model | When validating a hypothesis |
My approach: Lean Canvas for the first 2-3 months while you're still searching for product-market fit. BMC once PMF is found and you need to build a financial model for scaling. They don't compete — they complement each other.
In practice, I recommend starting with Lean Canvas (problem -> solution -> key metrics), then transitioning to BMC (expand to 9 blocks with numbers), then to a full P&L model. Each step adds specificity and numbers.
Canvas Evolution: Update, Don't Start Over
The biggest mistake is treating Canvas as a one-time exercise. In my experience, successful teams update their canvas quarterly, adjusting numbers against actuals:
Quarter 1: Hypothesis — 5% churn. Actual — 8%. Action: revisit Customer Relationships, add onboarding scenarios, recalculate LTV.
Quarter 2: Hypothesis — 33 customers/mo. Actual — 22 from paid channels, but 15 from organic (not accounted for). Action: add the channel, redistribute budget, recalculate CAC.
Quarter 3: Hypothesis — Enterprise is 15% of new customers. Actual — 25%. Action: increase ARPU forecast, hire CSM, recalculate break-even.
Canvas is a living document. Every change in one block cascades through the entire financial model. That's why the Canvas-P&L connection should be technical, not conceptual: change Channels -> CAC recalculates -> break-even shifts -> runway updates.
In ProductWave, the Canvas tab is connected to the P&L model: each canvas block maps to corresponding model sections. Change an acquisition channel on Canvas — see how it affects the metrics dashboard. This turns a strategic framework into a working tool.
Wrapping Up
Business Model Canvas is a powerful tool. But only when there are numbers behind the sticky notes. Here are the key principles:
-
Each BMC block = a P&L line. Value Proposition determines price, Channels determine CAC, Relationships determine churn, Revenue Streams are income, Cost Structure is expenses. If a block can't be translated into a number, it hasn't been properly developed.
-
Segmentation is everything. One ARPU, one churn, one CAC is fiction. Break Customer Segments into 2-3 cohorts with different parameters, and the model becomes an order of magnitude more accurate.
-
Canvas without updates is dead. Fill it once and forget — you lose the connection between strategy and reality. Quarterly plan-vs-actual analysis on every block.
-
From Lean Canvas to BMC to P&L. These aren't three different documents but the evolution of one: from hypothesis to model to calculation. Each stage adds specificity.
-
Live Canvas-P&L connection. A change in any block should automatically recalculate the financial model. If you need to manually re-enter formulas for that — the tool doesn't work.
If you want to try the Canvas + P&L connection in practice — ProductWave lets you fill in the canvas and immediately see how each block affects financial metrics. The free tier lets you build a model and check whether your business model works in numbers — before you spend your first dollar.
March 10, 2026
StrategyStartupsGuideProduct Management