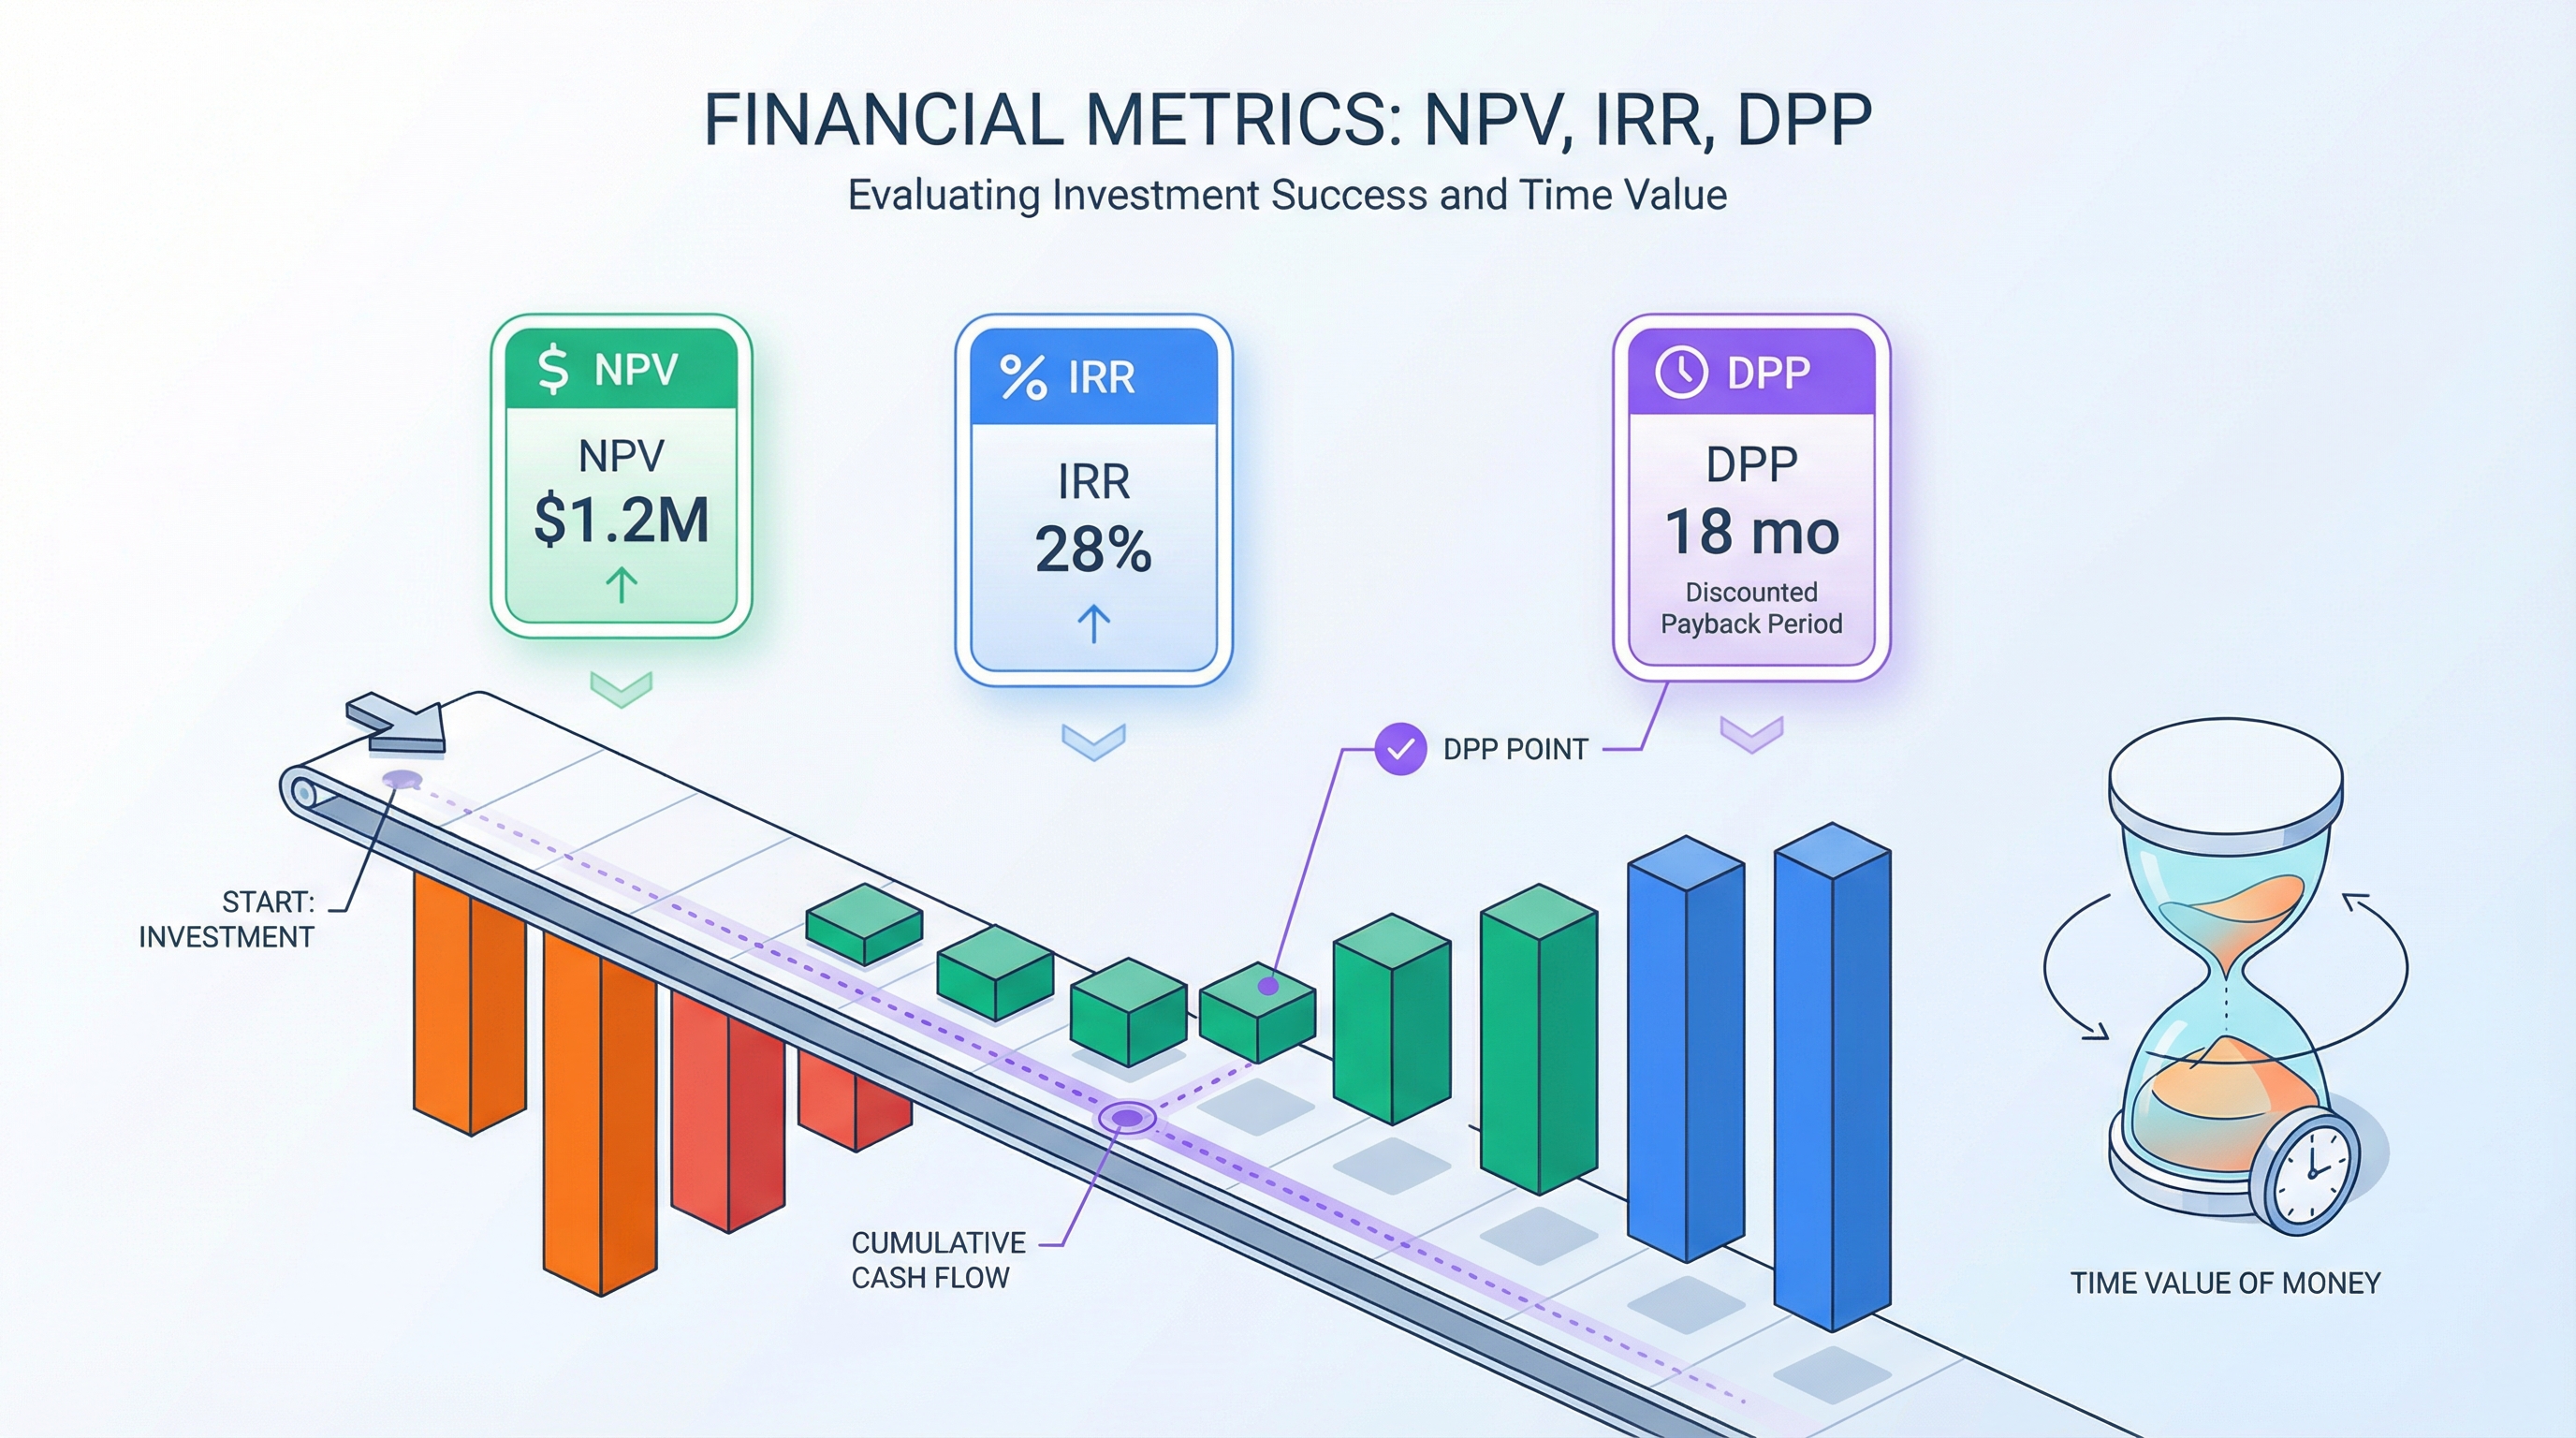
NPV, IRR, DPP in Plain Language: How to Evaluate Your Project's Investment Appeal
You walk into an investor meeting with your model. You show revenue growth, acquisition channels, unit economics. The investor nods and asks: "What's the NPV? What's the IRR? When's the discounted payback?"
If you can't answer, the conversation is over. Not because your project is bad, but because you're speaking different languages. NPV, IRR, and DPP are the language investors use to evaluate projects. Not the only language, but the foundational one. Without it, you're negotiating in Tokyo without a translator.
In this article: three metrics with formulas, step-by-step calculations on a concrete example, and the mistakes I see founders make repeatedly.
Why Startups Need Investment Metrics
Investment metrics answer three fundamental questions:
| Question | Metric | Answer |
|---|---|---|
| Does the project create value? | NPV | Yes, if NPV > 0 |
| What return does the project generate? | IRR | Compare with WACC or alternatives |
| When does the money come back? | DPP | X months, accounting for discounting |
For founders, these metrics are not formalities. They help you:
- Compare options: launch a new product or expand the current one? Invest in marketing or R&D? NPV and IRR provide an objective basis for comparison.
- Speak the investor's language: a fund looks at dozens of projects. All of them promise "revenue growth." NPV lets them compare apples to apples.
- Assess sensitivity: how does NPV change if CAC increases by 30%? This connects directly to scenario analysis.
NPV — Net Present Value
The Idea: A Dollar Today Is Not a Dollar Next Year
Imagine you're offered 1,050,000. This means 1,000,000 today.
This is the fundamental principle of finance — the time value of money. NPV converts all future cash flows into "today's dollars" so they can be fairly summed.
Formula
Where:
- — net cash flow in period (revenue minus expenses)
- — discount rate (per period)
- — forecast horizon (number of periods)
- — initial investment
Each future cash flow is divided by — that's the discounting. The further into the future a cash flow is, the less it "weighs" in today's money.
Discount Rate: How to Choose
The discount rate is the most debated parameter in all of finance. Three approaches:
WACC (Weighted Average Cost of Capital) — blends the cost of equity and debt. For a startup with no debt, WACC = cost of equity, which essentially = the investor's expected return.
Opportunity cost — the return on the best alternative. If an investor can put money in an index fund at 12% annually, your project needs to beat that.
Risk premium — risk-free rate + risk premium. For early-stage startups, the premium can be 20-40% annually (which is why investors look for projects with IRR > 30%).
Practical benchmarks for annual rates:
| Project Stage | Discount Rate |
|---|---|
| Stable business | 10-15% |
| Startup with MVP and revenue | 20-30% |
| Pre-seed startup | 30-50% |
| High-risk R&D | 40-60% |
For monthly calculations, convert: . At 15% annual: .
Example: Startup With $50,000 Investment
Let's say you're launching a B2B SaaS product. Initial investment: $50,000. Horizon: 36 months. Discount rate: 15% annually (1.17% monthly).
Simplified P&L by quarters (for readability; in a real model, use monthly):
| Quarter | Revenue | Expenses | Net CF | Discounted CF | Cumulative DCF |
|---|---|---|---|---|---|
| Q1 (mo 1-3) | $0 | $4,500 | -$4,500 | -$4,344 | -$4,344 |
| Q2 (mo 4-6) | $1,200 | $5,200 | -$4,000 | -$3,728 | -$8,072 |
| Q3 (mo 7-9) | $3,800 | $5,800 | -$2,000 | -$1,798 | -$9,870 |
| Q4 (mo 10-12) | $6,800 | $6,200 | +$600 | +$520 | -$9,350 |
| Q5 (mo 13-15) | $10,500 | $7,000 | +$3,500 | +$2,926 | -$6,424 |
| Q6 (mo 16-18) | $14,800 | $7,800 | +$7,000 | +$5,648 | -$776 |
| Q7 (mo 19-21) | $19,500 | $8,500 | +$11,000 | +$8,563 | +$7,787 |
| Q8 (mo 22-24) | $25,000 | $9,200 | +$15,800 | +$11,869 | +$19,656 |
| Q9 (mo 25-27) | $31,000 | $10,000 | +$21,000 | +$15,212 | +$34,868 |
| Q10 (mo 28-30) | $37,500 | $10,800 | +$26,700 | +$18,664 | +$53,532 |
| Q11 (mo 31-33) | $44,000 | $11,600 | +$32,400 | +$21,862 | +$75,394 |
| Q12 (mo 34-36) | $51,000 | $12,500 | +$38,500 | +$25,081 | +$100,475 |
Interpretation: NPV > 0 = The Project Creates Value
NPV > 0 means the project returns more than the cost of capital. Accounting for all risks (embedded in the 15% rate), the investor gets $50,475 more than they would by investing at 15% annually.
NPV = 0 — the project just matches the alternative. Not worthwhile if the alternative carries less risk.
NPV < 0 — the project destroys value. Better to invest elsewhere.
Key nuance: NPV depends on the discount rate. At r = 15%, NPV is positive. At r = 40%, it might turn negative — because you're demanding a higher return threshold. This fact leads us to the next metric.
IRR — Internal Rate of Return
The Idea: At What Rate Does the Project Break Even
IRR (Internal Rate of Return) is the discount rate at which NPV = 0. In other words, it's the return the project generates for the investor.
IRR can't be solved analytically (it's a polynomial of degree ) — it's found iteratively. The bisection method: take two values of (one where NPV > 0, one where NPV < 0) and narrow the interval until you find the root.
For our example, IRR = 42% annually. This means: if a deposit existed that paid 42% per year, it would generate exactly the same value as your project with its specific cash flow pattern.
The Rule: IRR > WACC = Profitable Project
Comparing IRR with WACC (or the investor's expected return):
| Situation | Conclusion |
|---|---|
| IRR > WACC (with margin) | Project is attractive |
| IRR = WACC | Project is marginal, no risk premium |
| IRR < WACC | Project doesn't cover cost of capital |
For startups: a seed-stage investor expects IRR > 30-40%. If your IRR = 42%, the project clears the bar — provided the numbers are defensible. Series A investors may accept IRR = 25-30% because the risk is lower (there's traction).
The Traps of IRR: Why the Metric Isn't Perfect
IRR is popular but dangerous. Three traps:
1. Multiple solutions. If cash flows change sign more than once (+ to - to +), the equation can have multiple roots. Which one is the "real" IRR? Formally — all of them. In practice, use MIRR (Modified IRR) or rely on NPV.
2. The scale problem. Project A: 10M investment, IRR = 25%. IRR says "choose A." But Project B creates 50K. If you have $10M to deploy, the choice is obvious.
3. Reinvestment assumption. IRR assumes intermediate cash flows are reinvested at the same IRR rate. If your IRR = 42% but you can realistically reinvest only at 10%, IRR overstates the actual return.
This is why IRR should always be used alongside NPV, never instead of it.
DPP — Discounted Payback Period
PP vs DPP: Why Simple Payback Is Misleading
Simple Payback Period (PP) is the moment when cumulative cash flow turns positive:
In our example, cumulative (undiscounted) CF crosses zero at roughly month 16. PP = 16 months.
The problem: PP doesn't account for the time value of money. 10,000 at month 1. But it shouldn't — money loses value over time.
DPP (Discounted Payback Period) is the moment when cumulative discounted cash flow turns positive:
Step-by-Step Calculation
For our example (15% annual = 1.17% monthly). Monthly detail for the critical period:
| Month | Net CF | Discount Factor | Discounted CF | Cumulative DCF | Remaining |
|---|---|---|---|---|---|
| 1 | -$1,500 | 0.9884 | -$1,483 | -$1,483 | -$51,483 |
| ... | ... | ... | ... | ... | ... |
| 6 | -$800 | 0.9321 | -$746 | -$8,072 | -$58,072 |
| ... | ... | ... | ... | ... | ... |
| 12 | +$500 | 0.8694 | +$435 | -$9,350 | -$59,350 |
| ... | ... | ... | ... | ... | ... |
| 15 | +$1,300 | 0.8391 | +$1,091 | -$6,424 | -$56,424 |
| 16 | +$1,800 | 0.8293 | +$1,493 | -$4,931 | -$54,931 |
| 17 | +$2,200 | 0.8196 | +$1,803 | -$3,128 | -$53,128 |
| 18 | +$2,700 | 0.8100 | +$2,187 | -$941 | -$50,941 |
| 19 | +$3,100 | 0.8006 | +$2,482 | +$1,541 | -$48,459 |
| 20 | +$3,500 | 0.7912 | +$2,769 | +$4,310 | -$45,690 |
| 21 | +$4,100 | 0.7820 | +$3,206 | +$7,516 | -$42,484 |
Cumulative DCF (before subtracting the initial investment) crosses $50,000 at approximately month 20-21. So:
- PP (simple) = ~16 months
- DPP (discounted) = ~20-21 months
The 4-5 month gap is typical for a 3-year horizon at 15%. At higher discount rates, the gap widens.
Three Metrics Together: Comprehensive Assessment
NPV for Value, IRR for Comparison, DPP for Risk
Each metric answers its own question. One alone is insufficient:
- NPV — "How much wealthier will you become?" An absolute value. Lets you compare projects of different sizes by value created.
- IRR — "What return will you earn?" A relative value. Lets you compare projects with different investment amounts (with caveats about scale).
- DPP — "When does the money come back?" A risk metric. The longer the payback, the higher the uncertainty.
Three Projects, Three Metrics — Which One to Pick?
| Metric | Project A: SaaS | Project B: Marketplace | Project C: API Platform |
|---|---|---|---|
| Investment | $50,000 | $150,000 | $30,000 |
| NPV (r=15%) | +$50,475 | +$123,000 | +$18,000 |
| IRR | 42% | 35% | 55% |
| DPP | 21 mo | 26 mo | 14 mo |
Which one to choose? Depends on context:
- If budget is capped at $50K — Project A (highest NPV within budget) or Project C (faster payback, higher IRR, but lower absolute NPV).
- If budget is $150K and the goal is maximum value — Project B (highest absolute NPV).
- If the priority is minimum risk — Project C (shortest DPP and highest IRR).
When Metrics Contradict Each Other
Contradictions are inevitable. The typical conflict: high IRR vs. high NPV. Project C delivers 55% IRR but only 123K NPV.
The rule: for mutually exclusive projects, prioritize NPV. IRR can mislead due to the scale problem. NPV directly shows how much value is created.
For portfolio approaches (you can do multiple projects), use IRR for ranking and NPV for absolute contribution assessment.
Common Calculation Mistakes
Five mistakes I see in models regularly:
1. Mixing Nominal and Real Cash Flows
Nominal CFs (with inflation) + real discount rate (without inflation) = understated NPV. Real CFs + nominal rate = overstated NPV.
Rule: nominal cash flows are discounted at a nominal rate. Real cash flows at a real rate. The Fisher equation:
With 3% inflation and a 15% nominal rate: .
2. Infinite Horizon Without Terminal Value
Your model covers 36 months. The project continues beyond that. What happens after month 36? If the answer is "nothing," you're understating NPV. If you extend the model by another 120 months with growth assumptions, that's unreliable extrapolation.
Solution: Terminal Value (TV). The simplest approach is the Gordon Growth Model:
Where is the long-term growth rate (typically 2-3%, no higher than inflation). TV is discounted back to time 0 as a single cash flow at horizon :
In the startup context, Terminal Value often accounts for 50-70% of total NPV. Pay close attention to it.
3. IRR Without Considering Scale
As I mentioned: IRR = 100% on a 10M investment. Always look at NPV alongside IRR.
4. Ignoring Working Capital
The startup grows. Revenue grows. But accounts receivable also grow (B2B customers pay net-30 or net-60). Revenue growth on paper does not equal cash flow growth. If you model CF = Revenue - Expenses without accounting for changes in working capital, your NPV is overstated.
5. Picking a Rate "Out of Thin Air"
"Let's just use 10%" — a classic phrase. A 10% rate for a pre-seed startup is a rate for a stable business. You're understating risk and overstating NPV. Justify your rate: cost of equity, comparable analysis, or at minimum the consensus range for your stage.
Changing the rate from 15% to 25% can reduce NPV by 30-40%. That's enormous sensitivity — and a reason to use scenario analysis with different discount rates.
How to Automate the Calculation
Computing NPV manually over 36 months is feasible but tedious. 36 discounted cash flows, IRR via iterations, three or four scenarios — and you've spent half a day in a spreadsheet.
When building a P&L model, you're already generating monthly cash flows. Investment metrics are just a layer on top: discounting CFs, finding where cumulative DCF crosses zero (DPP), and iteratively solving for the IRR root.
In ProductWave, NPV, IRR, and DPP are calculated automatically from your P&L model. You set the discount rate and initial investment — metrics update every time you change any parameter. Combined with scenario analysis, this gives you the full picture: NPV under base, pessimistic, and optimistic scenarios; IRR for each; and DPP plotted on a cumulative discounted cash flow chart.
Cheat Sheet
| Metric | What It Shows | When to Use |
|---|---|---|
| NPV | Whether the project creates value above the alternative (accounting for discounting) | Comparing projects of different scale; absolute attractiveness assessment. The priority metric when it conflicts with IRR |
| IRR | What annual return the project generates (the rate at which NPV = 0) | Comparing project returns; checking against WACC and investor expectations. Caution: doesn't account for scale |
| DPP | When the money comes back, accounting for time value | Risk assessment; critical for startups with limited runway. Always compute the discounted version, not simple PP |
Above all, remember the discount rate. A 5-percentage-point error changes NPV by tens of percent, so justify your rate choice and test sensitivity.
Try ProductWave — build a P&L model and NPV, IRR, DPP will calculate automatically from your cash flows. You already understand the formulas; leave the arithmetic to the tool.
March 1, 2026
InvestmentFinancial ModelingGuideStartups